实战:HPA(Pod 水平自动伸缩)-2021.11.23_hpa软件-程序员宅基地
技术标签: k8s

目录

实验环境
实验环境:
1、win10,vmwrokstation虚机;
2、k8s集群:3台centos7.6 1810虚机,1个master节点,2个node节点
   k8s version:v1.22.2
   containerd://1.5.5
实验软件
链接:https://pan.baidu.com/s/1I2oQvi2GC1g5J0vxOBooqg
提取码:59mi
–来自百度网盘超级会员V6的分享
1、基础知识
1.HPA 控制器
在前面的学习中我们使用了一个 kubectl scale 命令可以来实现 Pod 的扩缩容功能,但是这个是完全手动操作的,要应对线上的各种复杂情况,**我们需要能够做到自动化去感知业务,来自动进行扩缩容。**为此,Kubernetes 也为我们提供了这样的一个资源对象:Horizontal Pod Autoscaling(Pod 水平自动伸缩),简称 HPA,HPA 通过监控分析一些控制器控制的所有 Pod 的负载变化情况来确定是否需要调整 Pod 的副本数量,这是 HPA 最基本的原理:
我们可以简单的通过 kubectl autoscale 命令来创建一个 HPA 资源对象,HPA Controller 默认30s轮询一次(可通过 kube-controller-manager 的--horizontal-pod-autoscaler-sync-period 参数进行设置),查询指定的资源中的 Pod 资源使用率,并且与创建时设定的值和指标做对比,从而实现自动伸缩的功能。
2.Metrics Server
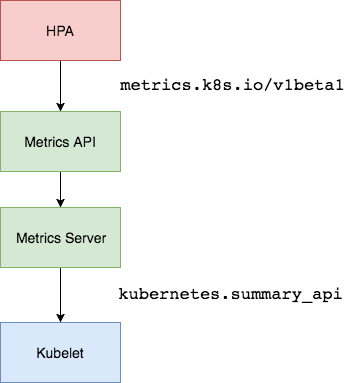
在 HPA 的第一个版本中,我们需要 Heapster(目前这个已经废弃了) 提供 CPU 和内存指标,在 HPA v2 过后就需要安装 Metrcis Server 了,Metrics Server 可以通过标准的 Kubernetes API 把监控数据暴露出来,有了 Metrics Server 之后,我们就完全可以通过标准的 Kubernetes API 来访问我们想要获取的监控数据了:
https://10.96.0.1/apis/metrics.k8s.io/v1beta1/namespaces/<namespace-name>/pods/<pod-name>
比如当我们访问上面的 API 的时候,我们就可以获取到该 Pod 的资源数据,**这些数据其实是来自于 kubelet 的 Summary API 采集而来的。**不过需要说明的是我们这里可以通过标准的 API 来获取资源监控数据,并不是因为 Metrics Server 就是 APIServer 的一部分,而是通过 Kubernetes 提供的 Aggregator(聚合器) 汇聚插件来实现的,是独立于 APIServer 之外运行的。
a.聚合 API
Aggregator 允许开发人员编写一个自己的服务,把这个服务注册到 Kubernetes 的 APIServer 里面去,这样我们就可以像原生的 APIServer 提供的 API 使用自己的 API 了,我们把自己的服务运行在 Kubernetes 集群里面,然后 Kubernetes 的 Aggregator 通过 Service 名称就可以转发到我们自己写的 Service 里面去了。这样这个聚合层就带来了很多好处:
- 增加了 API 的扩展性:开发人员可以编写自己的 API 服务来暴露他们想要的 API。
- 丰富了 API:核心 kubernetes 团队阻止了很多新的 API 提案,通过允许开发人员将他们的 API 作为单独的服务公开,这样就无须社区繁杂的审查了。
- 开发分阶段实验性 API:新的 API 可以在单独的聚合服务中开发,当它稳定之后,在合并会 APIServer 就很容易了。
- 确保新 API 遵循 Kubernetes 约定:如果没有这里提出的机制,社区成员可能会被迫推出自己的东西,这样很可能造成社区成员和社区约定不一致。
3.什么是vpa
hpa:水平自动扩缩容
vpa:垂直自动扩缩容,我始终在一个pod里面,假设我的memory limits是100Mi,但是现在已经用到了98Mi,如果再大的话就oom了,此时vpa会在垂直方向上提升你的memory limits的大小。这种vpa比较适合一些资源消耗比较大的应用,例如es,你给大了资源浪费,给小了,又不够。所以vpa就派上用场了。当然,vpa不像hpa默认集成在k8s里面的,需要你自己去配置的。
另外:vpa会涉及一些CRD的operator里的一些知识。
[root@master1 ~]#vim hpa-demo.yaml
apiVersion: apps/v1
kind: Deployment
metadata:
  name: hpa-demo
spec:
  selector:
    matchLabels:
      app: nginx
  template:
    metadata:
      labels:
        app: nginx
    spec:
      containers:
      - name: nginx
        image: nginx
        ports:
        - containerPort: 80
        resources:
          requests:
            memory: 50Mi
            cpu: 50m
          limits:
            memory: 100Mi
            cpu: 100m
2、实战演示
实战演示1:安装metrics-server
安装前须知
需要开启Aggreator
所以现在我们要使用 HPA,就需要在集群中安装 Metrics Server 服务,要安装 Metrics Server 就需要开启 Aggregator,因为 Metrics Server 就是通过该代理进行扩展的,不过我们集群是通过 Kubeadm 搭建的,默认已经开启了,如果是二进制方式安装的集群,需要单独配置 kube-apsierver 添加如下所示的参数:
--requestheader-client-ca-file=<path to aggregator CA cert>
--requestheader-allowed-names=aggregator
--requestheader-extra-headers-prefix=X-Remote-Extra-
--requestheader-group-headers=X-Remote-Group
--requestheader-username-headers=X-Remote-User
--proxy-client-cert-file=<path to aggregator proxy cert>
--proxy-client-key-file=<path to aggregator proxy key>
这里我们可以看一下当时用kubeadm搭建的k8s集群的kube-apiserver.yaml文件:
[root@master1 ~]#cat /etc/kubernetes/manifests/kube-apiserver.yaml
……
    - --proxy-client-cert-file=/etc/kubernetes/pki/front-proxy-client.crt
    - --proxy-client-key-file=/etc/kubernetes/pki/front-proxy-client.key
    - --requestheader-allowed-names=front-proxy-client
    - --requestheader-client-ca-file=/etc/kubernetes/pki/front-proxy-ca.crt
    - --requestheader-extra-headers-prefix=X-Remote-Extra-
    - --requestheader-group-headers=X-Remote-Group
    - --requestheader-username-headers=X-Remote-User
……
如果 kube-proxy 没有和 APIServer 运行在同一台主机上,那么需要确保启用了如下 kube-apsierver 的参数:
--enable-aggregator-routing=true
对于这些证书的生成方式,我们可以查看官方文档:https://github.com/kubernetes-sigs/apiserver-builder-alpha/blob/master/docs/concepts/auth.md。
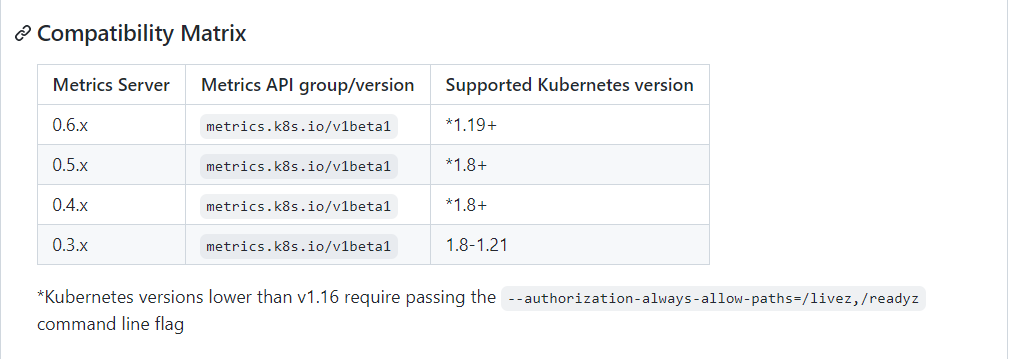
我们可以先来看看这个metrics server的gitbub地址:
https://github.com/kubernetes-sigs/metrics-server

step1:下载仓库官方metrics server安装的资源清单
Aggregator 聚合层启动完成后,就可以来安装 Metrics Server 了,我们可以获取该仓库的官方安装资源清单:
# 官方仓库地址:https://github.com/kubernetes-sigs/metrics-server
➜  ~ wget https://github.com/kubernetes-sigs/metrics-server/releases/download/v0.5.1/components.yaml

[root@master1 ~]#wget https://download.fastgit.org/kubernetes-sigs/metrics-server/releases/download/v0.5.1/components.yaml
[root@master1 ~]#ll -h components.yaml
-rw-r--r-- 1 root root 4.1K Sep 26 17:37 components.yaml
[root@master1 ~]#
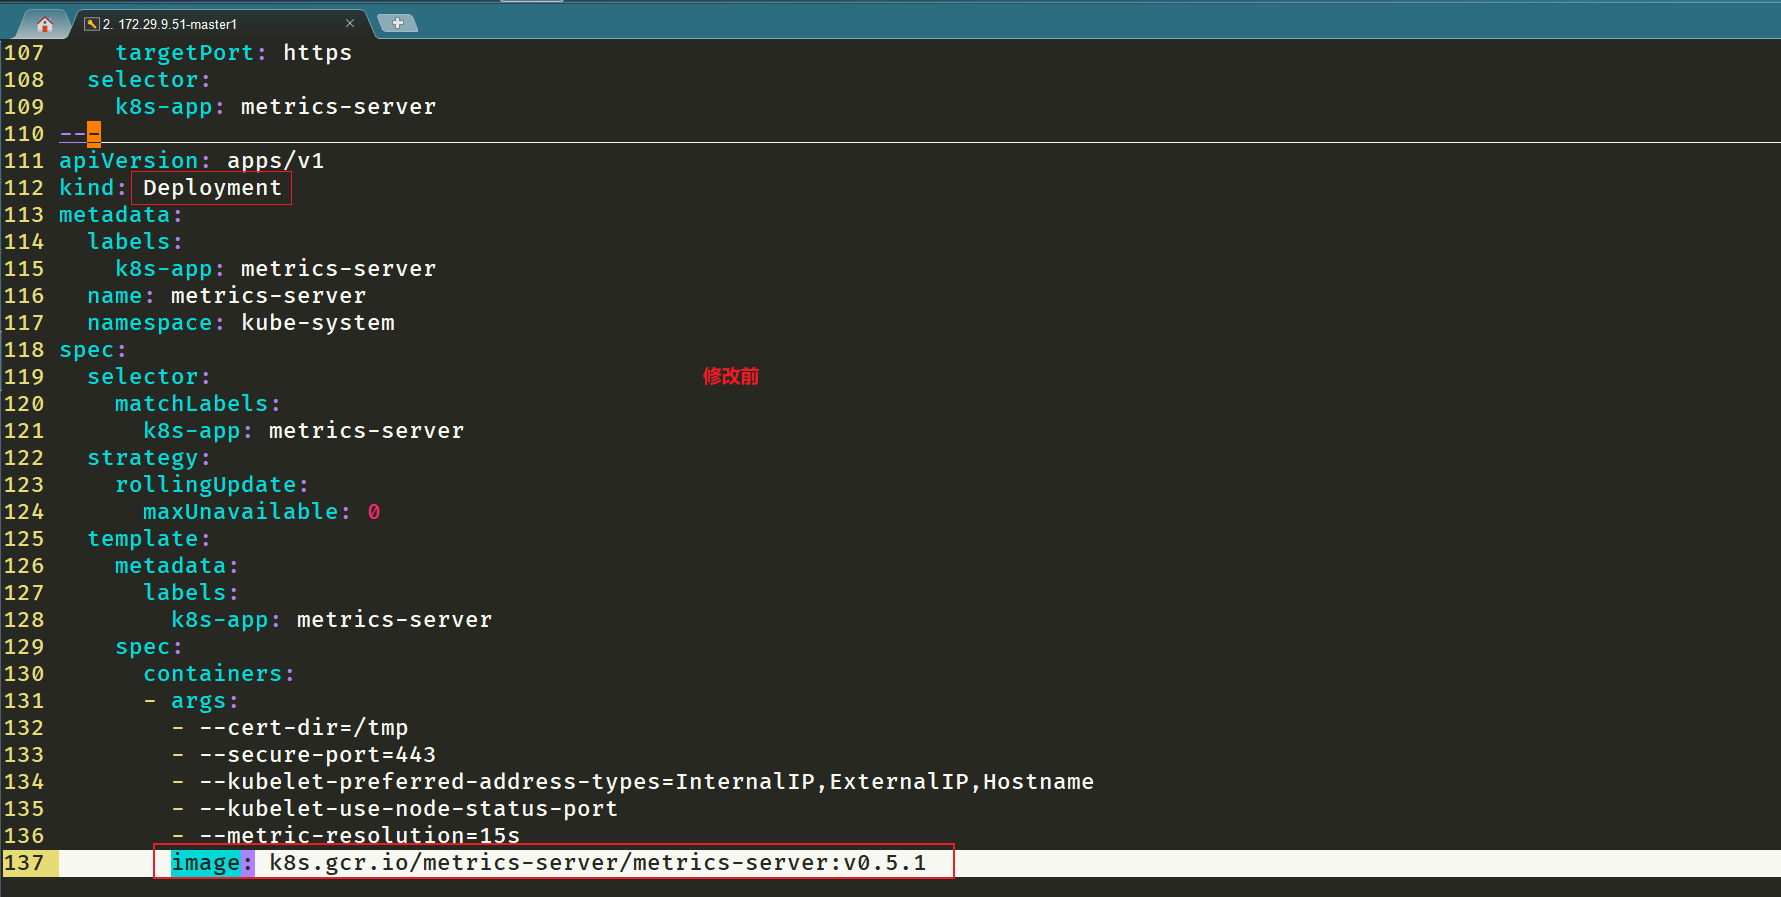
step2:修改 components.yaml 的镜像地址
在部署之前,修改 components.yaml 的镜像地址
#默认信息如下
[root@master1 ~]#vim components.yaml
……
137 image: k8s.gcr.io/metrics-server/metrics-server:v0.5.1
……
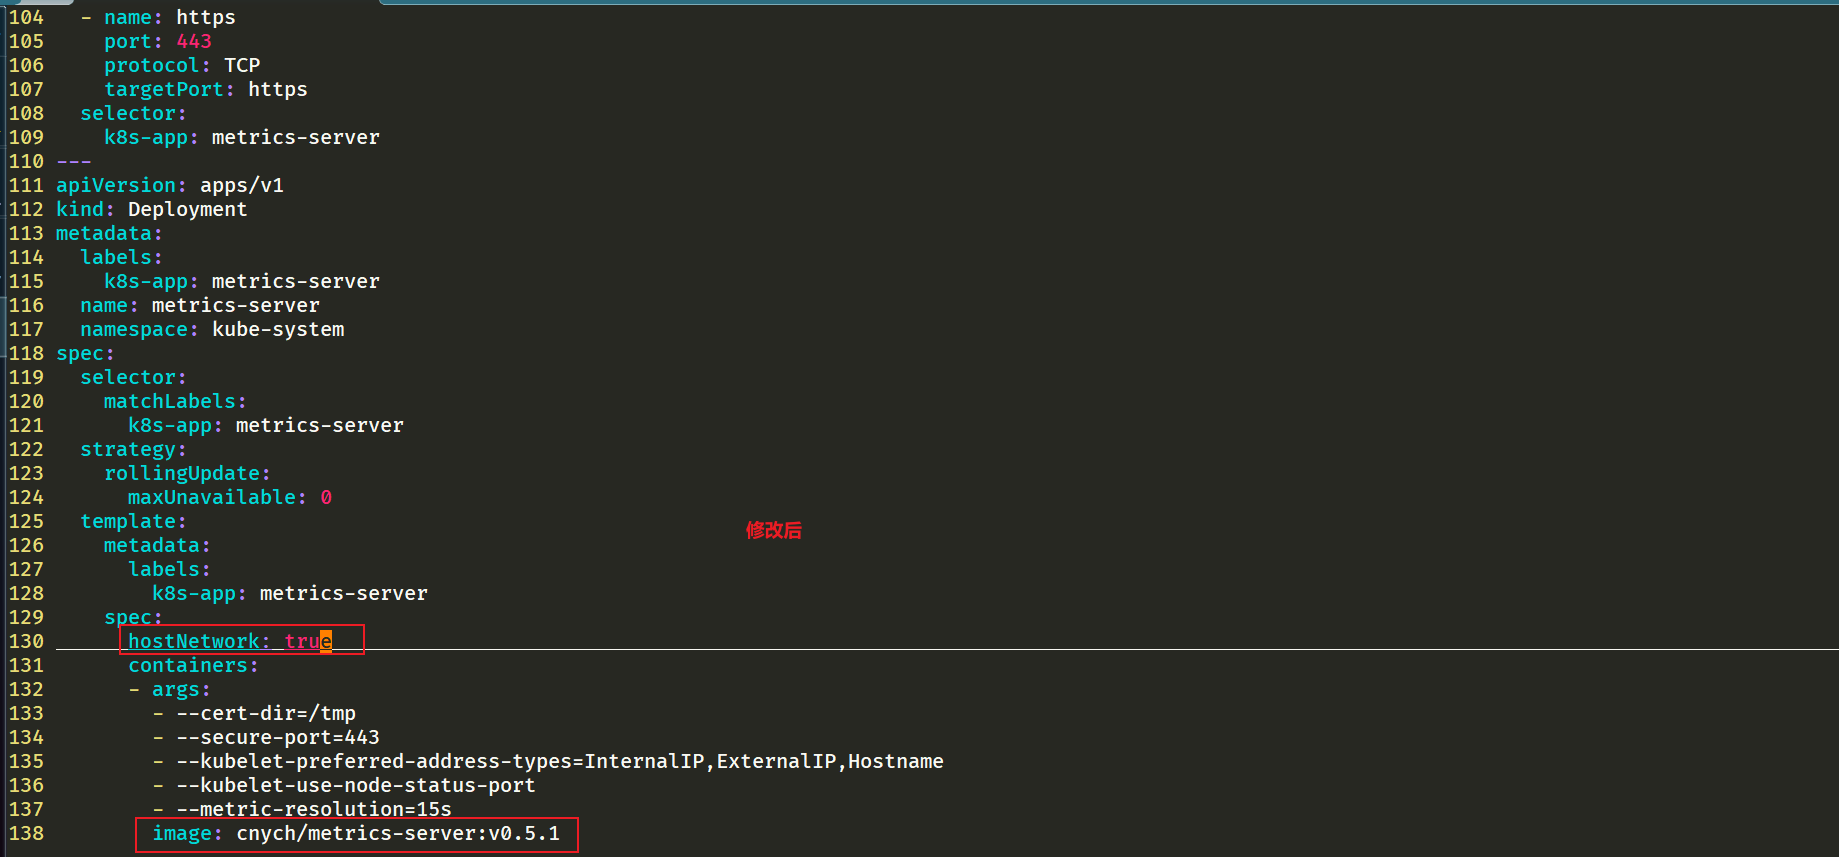
#修改为如下:
hostNetwork: true # #修改地方1 注意:使用hostNetwork模式
containers:
- name: metrics-server
image: cnych/metrics-server:v0.5.1 #修改地方2
step3:部署并查看pod日志
等部署完成后,可以查看 Pod 日志是否正常
[root@master1 ~]#kubectl apply -f components.yaml
serviceaccount/metrics-server created
clusterrole.rbac.authorization.k8s.io/system:aggregated-metrics-reader created
clusterrole.rbac.authorization.k8s.io/system:metrics-server created
rolebinding.rbac.authorization.k8s.io/metrics-server-auth-reader created
clusterrolebinding.rbac.authorization.k8s.io/metrics-server:system:auth-delegator created
clusterrolebinding.rbac.authorization.k8s.io/system:metrics-server created
service/metrics-server created
deployment.apps/metrics-server created
apiservice.apiregistration.k8s.io/v1beta1.metrics.k8s.io created

[root@master1 ~]#kubectl get po -nkube-system  -l k8s-app=metrics-server
NAME                              READY   STATUS    RESTARTS   AGE
metrics-server-859bf7c488-gzgc2   0/1     Running   0          14s

[root@master1 ~]#kubectl logs -f metrics-server-859bf7c488-gzgc2 -nkube-system
I1121 14:02:02.659804       1 shared_informer.go:247] Caches are synced for RequestHeaderAuthRequestController
I1121 14:02:02.660030       1 shared_informer.go:247] Caches are synced for client-ca::kube-system::extension-apiserver-authentication::client-ca-file
E1121 14:02:17.483842       1 scraper.go:139] "Failed to scrape node" err="Get \"https://172.29.9.52:10250/stats/summary?only_cpu_and_memory=true\": x509: cannot validate certificate for 172.29.9.52 because it doesn't contain any IP SANs" node="node1"
E1121 14:02:17.488667       1 scraper.go:139] "Failed to scrape node" err="Get \"https://172.29.9.53:10250/stats/summary?only_cpu_and_memory=true\": x509: cannot validate certificate for 172.29.9.53 because it doesn't contain any IP SANs" node="node2"
E1121 14:02:17.491507       1 scraper.go:139] "Failed to scrape node" err="Get \"https://172.29.9.51:10250/stats/summary?only_cpu_and_memory=true\": x509: cannot validate certificate for 172.29.9.51 because it doesn't contain any IP SANs" node="master1"
I1121 14:02:26.729083       1 server.go:188] "Failed probe" probe="metric-storage-ready" err="not metrics to serve"
E1121 14:02:32.493248       1 scraper.go:139] "Failed to scrape node" err="Get \"https://172.29.9.52:10250/stats/summary?only_cpu_and_memory=true\": x509: cannot validate certificate for 172.29.9.52 because it doesn't contain any IP SANs" node="node1"
E1121 14:02:32.496511       1 scraper.go:139] "Failed to scrape node" err="Get \"https://172.29.9.53:10250/stats/summary?only_cpu_and_memory=true\": x509: cannot validate certificate for 172.29.9.53 because it doesn't contain any IP SANs" node="node2"
E1121 14:02:32.497923       1 scraper.go:139] "Failed to scrape node" err="Get \"https://172.29.9.51:10250/stats/summary?only_cpu_and_memory=true\": x509: cannot validate certificate for 172.29.9.51 because it doesn't contain any IP SANs" node="master1"
I1121 14:02:36.729694       1 server.go:188] "Failed probe" probe="metric-storage-ready" err="not metrics to serve"
I1121 14:02:46.724972       1 server.go:188] "Failed probe" probe="metric-storage-ready" err="not metrics to serve"
E1121 14:02:47.482222       1 scraper.go:139] "Failed to scrape node" err="Get \"https://172.29.9.53:10250/stats/summary?only_cpu_and_memory=true\": x509: cannot validate certificate for 172.29.9.53 because it doesn't contain any IP SANs" node="node2"
E1121 14:02:47.483545       1 scraper.go:139] "Failed to scrape node" err="Get \"https://172.29.9.52:10250/stats/summary?only_cpu_and_memory=true\": x509: cannot validate certificate for 172.29.9.52 because it doesn't contain any IP SANs" node="node1"
E1121 14:02:47.484900       1 scraper.go:139] "Failed to scrape node" err="Get \"https://172.29.9.51:10250/stats/summary?only_cpu_and_memory=true\": x509: cannot validate certificate for 172.29.9.51 because it doesn't contain any IP SANs" node="master1"
I1121 14:02:56.730788       1 server.go:188] "Failed probe" probe="metric-storage-ready" err="not metrics to serve"
E1121 14:03:02.474429       1 scraper.go:139] "Failed to scrape node" err="Get \"https://172.29.9.52:10250/stats/summary?only_cpu_and_memory=true\": x509: cannot validate certificate for 172.29.9.52 because it doesn't contain any IP SANs" node="node1"
E1121 14:03:02.481516       1 scraper.go:139] "Failed to scrape node" err="Get \"https://172.29.9.51:10250/stats/summary?only_cpu_and_memory=true\": x509: cannot validate certificate for 172.29.9.51 because it doesn't contain any IP SANs" node="master1"
E1121 14:03:02.495061       1 scraper.go:139] "Failed to scrape node" err="Get \"https://172.29.9.53:10250/stats/summary?only_cpu_and_memory=true\": x509: cannot validate certificate for 172.29.9.53 because it doesn't contain any IP SANs" node="node2"
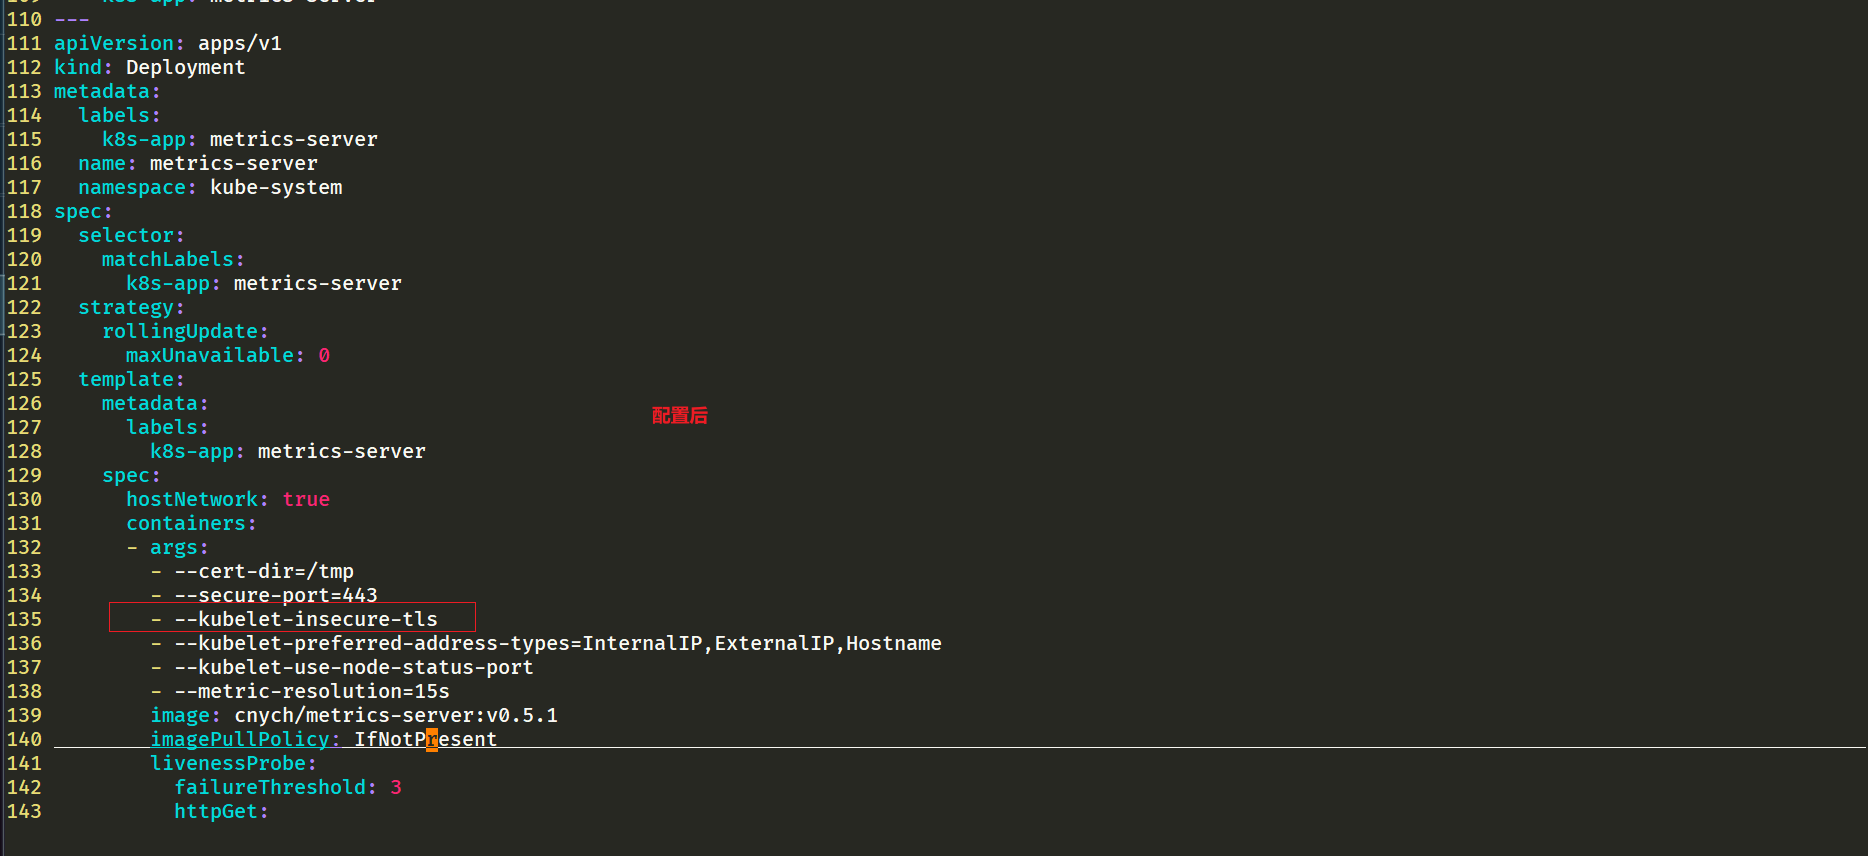
step4:添加一个--kubelet-insecure-tls参数跳过证书校验
因为部署集群的时候,CA 证书并没有把各个节点的 IP 签上去,所以这里 Metrics Server 通过 IP 去请求时,提示签的证书没有对应的 IP(错误:x509: cannot validate certificate for 172.29.9.52 because it doesn't contain any IP SANs),我们可以添加一个--kubelet-insecure-tls参数跳过证书校验:
个人对这里的知识点有些模糊。。。
[root@master1 ~]#vim components.yaml
args:
- --cert-dir=/tmp
- --secure-port=4443
- --kubelet-insecure-tls #修改1:
- --kubelet-preferred-address-types=InternalIP
step5:再次部署并查看
然后再重新安装即可成功!可以通过如下命令来验证:
[root@master1 ~]#kubectl apply -f components.yaml
serviceaccount/metrics-server unchanged
clusterrole.rbac.authorization.k8s.io/system:aggregated-metrics-reader unchanged
clusterrole.rbac.authorization.k8s.io/system:metrics-server unchanged
rolebinding.rbac.authorization.k8s.io/metrics-server-auth-reader unchanged
clusterrolebinding.rbac.authorization.k8s.io/metrics-server:system:auth-delegator unchanged
clusterrolebinding.rbac.authorization.k8s.io/system:metrics-server unchanged
service/metrics-server unchanged
deployment.apps/metrics-server configured
apiservice.apiregistration.k8s.io/v1beta1.metrics.k8s.io unchanged

[root@master1 ~]#kubectl get po -nkube-system -l k8s-app=metrics-server
NAME                              READY   STATUS    RESTARTS   AGE
metrics-server-76b8bfbb47-8v2lr   1/1     Running   0          68s

[root@master1 ~]#kubectl logs -f metrics-server-76b8bfbb47-8v2lr -nkube-system
I1121 14:14:21.820418       1 serving.go:341] Generated self-signed cert (/tmp/apiserver.crt, /tmp/apiserver.key)
I1121 14:14:22.641351       1 requestheader_controller.go:169] Starting RequestHeaderAuthRequestController
I1121 14:14:22.641382       1 shared_informer.go:240] Waiting for caches to sync for RequestHeaderAuthRequestController
I1121 14:14:22.641418       1 configmap_cafile_content.go:202] Starting client-ca::kube-system::extension-apiserver-authentication::client-ca-file
I1121 14:14:22.641427       1 shared_informer.go:240] Waiting for caches to sync for client-ca::kube-system::extension-apiserver-authentication::client-ca-file
I1121 14:14:22.641444       1 configmap_cafile_content.go:202] Starting client-ca::kube-system::extension-apiserver-authentication::requestheader-client-ca-file
I1121 14:14:22.641480       1 shared_informer.go:240] Waiting for caches to sync for client-ca::kube-system::extension-apiserver-authentication::requestheader-client-ca-file
I1121 14:14:22.641800       1 secure_serving.go:202] Serving securely on [::]:443
I1121 14:14:22.641923       1 dynamic_serving_content.go:130] Starting serving-cert::/tmp/apiserver.crt::/tmp/apiserver.key
I1121 14:14:22.641952       1 tlsconfig.go:240] Starting DynamicServingCertificateController
I1121 14:14:22.743183       1 shared_informer.go:247] Caches are synced for client-ca::kube-system::extension-apiserver-authentication::requestheader-client-ca-file
I1121 14:14:22.743195       1 shared_informer.go:247] Caches are synced for client-ca::kube-system::extension-apiserver-authentication::client-ca-file
I1121 14:14:22.743300       1 shared_informer.go:247] Caches are synced for RequestHeaderAuthRequestController

[root@master1 ~]#kubectl get apiservices.apiregistration.k8s.io #我们来看一下api service服务
NAME                                   SERVICE                      AVAILABLE   AGE
v1.                                    Local                        True        21d
v1.admissionregistration.k8s.io        Local                        True        21d
v1.apiextensions.k8s.io                Local                        True        21d
v1.apps                                Local                        True        21d
v1.authentication.k8s.io               Local                        True        21d
v1.authorization.k8s.io                Local                        True        21d
v1.autoscaling                         Local                        True        21d
v1.batch                               Local                        True        21d
v1.certificates.k8s.io                 Local                        True        21d
v1.coordination.k8s.io                 Local                        True        21d
v1.discovery.k8s.io                    Local                        True        21d
v1.events.k8s.io                       Local                        True        21d
v1.networking.k8s.io                   Local                        True        21d
v1.node.k8s.io                         Local                        True        21d
v1.policy                              Local                        True        21d
v1.rbac.authorization.k8s.io           Local                        True        21d
v1.scheduling.k8s.io                   Local                        True        21d
v1.storage.k8s.io                      Local                        True        21d
v1beta1.batch                          Local                        True        21d
v1beta1.discovery.k8s.io               Local                        True        21d
v1beta1.events.k8s.io                  Local                        True        21d
v1beta1.flowcontrol.apiserver.k8s.io   Local                        True        21d
v1beta1.metrics.k8s.io                 kube-system/metrics-server   True        18m
v1beta1.node.k8s.io                    Local                        True        21d
v1beta1.policy                         Local                        True        21d
v1beta1.storage.k8s.io                 Local                        True        21d
v2beta1.autoscaling                    Local                        True        21d
v2beta2.autoscaling                    Local                        True        21d


[root@master1 ~]#kubectl get --raw "/apis/metrics.k8s.io/v1beta1/nodes"
{
    "kind":"NodeMetricsList","apiVersion":"metrics.k8s.io/v1beta1","metadata":{
    },"items":[{
    "metadata":{
    "name":"master1","creationTimestamp":"2021-11-21T14:22:54Z","labels":{
    "beta.kubernetes.io/arch":"amd64","beta.kubernetes.io/os":"linux","kubernetes.io/arch":"amd64","kubernetes.io/hostname":"master1","kubernetes.io/os":"linux","node-role.kubernetes.io/control-plane":"","node-role.kubernetes.io/master":"","node.kubernetes.io/exclude-from-external-load-balancers":""}},"timestamp":"2021-11-21T14:22:48Z","window":"20s","usage":{
    "cpu":"223908852n","memory":"1115576Ki"}},{
    "metadata":{
    "name":"node1","creationTimestamp":"2021-11-21T14:22:54Z","labels":{
    "beta.kubernetes.io/arch":"amd64","beta.kubernetes.io/os":"linux","kubernetes.io/arch":"amd64","kubernetes.io/hostname":"node1","kubernetes.io/os":"linux"}},"timestamp":"2021-11-21T14:22:44Z","window":"10s","usage":{
    "cpu":"55788161n","memory":"934188Ki"}},{
    "metadata":{
    "name":"node2","creationTimestamp":"2021-11-21T14:22:54Z","labels":{
    "beta.kubernetes.io/arch":"amd64","beta.kubernetes.io/os":"linux","kubernetes.io/arch":"amd64","kubernetes.io/hostname":"node2","kubernetes.io/os":"linux"}},"timestamp":"2021-11-21T14:22:47Z","window":"10s","usage":{
    "cpu":"1030374296n","memory":"877584Ki"}}]}
[root@master1 ~]#
step6:验证效果
现在我们可以通过 kubectl top 命令来获取到资源数据了,证明 Metrics Server 已经安装成功了。
[root@master1 ~]#kubectl top node
NAME      CPU(cores)   CPU%   MEMORY(bytes)   MEMORY%
master1   223m         11%    1090Mi          63%
node1     58m          2%     911Mi           53%
node2     1031m        51%    859Mi           49%

[root@master1 ~]#kubectl top po -nkube-system
NAME                              CPU(cores)   MEMORY(bytes)
coredns-7568f67dbd-9dls5          2m           26Mi
coredns-7568f67dbd-kqhjq          2m           17Mi
etcd-master1                      25m          125Mi
kube-apiserver-master1            109m         311Mi
kube-controller-manager-master1   30m          77Mi
kube-flannel-ds-5lm5t             3m           15Mi
kube-flannel-ds-rmtfk             3m           17Mi
kube-flannel-ds-xbp6g             3m           16Mi
kube-proxy-4sw76                  12m          31Mi
kube-proxy-mkghd                  1m           21Mi
kube-proxy-s2748                  6m           20Mi
kube-scheduler-master1            4m           35Mi
metrics-server-76b8bfbb47-8v2lr   5m           15Mi
[root@master1 ~]#
现在一切准备就绪,接下来我们就可以来测试HPA了。
实战演示2:测试HPA(默认是CPU的hpa)
step1:创建一个Nginx pod资源清单文件
现在我们用 Deployment 来创建一个 Nginx Pod,然后利用 HPA 来进行自动扩缩容。资源清单如下所示:
[root@master1 ~]#vim hpa-demo.yaml
# hpa-demo.yaml
apiVersion: apps/v1
kind: Deployment
metadata:
  name: hpa-demo
spec:
  selector:
    matchLabels:
      app: nginx
  template:
    metadata:
      labels:
        app: nginx
    spec:
      containers:
      - name: nginx
        image: nginx
        ports:
        - containerPort: 80
step2: 部署并查看
然后直接创建 Deployment,注意一定先把之前创建的具有 app=nginx 的 Pod 先清除掉:
[root@master1 ~]#kubectl apply -f hpa-demo.yaml
deployment.apps/hpa-demo created
[root@master1 ~]#kubectl get po
NAME                        READY   STATUS    RESTARTS   AGE
hpa-demo-7848d4b86f-fdfxw   1/1     Running   0          39s
step3: 创建一个 HPA 资源对象
现在我们来创建一个 HPA 资源对象,可以使用kubectl autoscale命令来创建:(我们也可以先用kubectl explains hpa.spec来查看下hpa资源的可用字段:)
[root@master1 ~]#kubectl autoscale deployment hpa-demo --cpu-percent=10 --min=1 --max=10
horizontalpodautoscaler.autoscaling/hpa-demo autoscaled
[root@master1 ~]#kubectl get hpa
NAME       REFERENCE             TARGETS         MINPODS   MAXPODS   REPLICAS   AGE
hpa-demo   Deployment/hpa-demo   <unknown>/10%   1         10        0          12s

#注意:这里的`unkown`字段和`replicas`字段,都是异常的;
此命令创建了一个关联资源 hpa-demo 的 HPA,最小的 Pod 副本数为1,最大为10。HPA 会根据设定的 cpu 使用率(10%)动态的增加或者减少 Pod 数量。
当然我们依然还是可以通过创建 YAML 文件的形式来创建 HPA 资源对象。如果我们不知道怎么编写的话,可以查看上面命令行创建的HPA的YAML文件:
[root@master1 ~]#kubectl get hpa -oyaml
apiVersion: v1
items:
- apiVersion: autoscaling/v1
  kind: HorizontalPodAutoscaler
  metadata:
    annotations:
      autoscaling.alpha.kubernetes.io/conditions: '[{
    "type":"AbleToScale","status":"True","lastTransitionTime":"2021-11-22T11:12:12Z","reason":"SucceededGetScale","message":"the
        HPA controller was able to get the target''s current scale"},{
    "type":"ScalingActive","status":"False","lastTransitionTime":"2021-11-22T11:12:12Z","reason":"FailedGetResourceMetric","message":"the
        HPA was unable to compute the replica count: failed to get cpu utilization:
        missing request for cpu"}]'
    creationTimestamp: "2021-11-22T11:11:57Z"
    name: hpa-demo
    namespace: default
    resourceVersion: "507353"
    uid: df884caa-e07d-49b0-ab95-6f67c05e522b
  spec:
    maxReplicas: 10
    minReplicas: 1
    scaleTargetRef:
      apiVersion: apps/v1
      kind: Deployment
      name: hpa-demo
    targetCPUUtilizationPercentage: 10
  status:
    currentReplicas: 1
    desiredReplicas: 0
kind: List
metadata:
  resourceVersion: ""
  selfLink: ""
[root@master1 ~]#
step4:发现一些fail信息并排查
然后我们可以根据上面的 YAML 文件就可以自己来创建一个基于 YAML 的 HPA 描述文件了。但是我们发现上面信息里面出现了一些 Fail 信息,我们来查看下这个 HPA 对象的信息:
[root@master1 ~]#kubectl describe hpa hpa-demo
Name:                                                  hpa-demo
Namespace:                                             default
Labels:                                                <none>
Annotations:                                           <none>
CreationTimestamp:                                     Mon, 22 Nov 2021 19:11:57 +0800
Reference:                                             Deployment/hpa-demo
Metrics:                                               ( current / target )
  resource cpu on pods  (as a percentage of request):  <unknown> / 10%
Min replicas:                                          1
Max replicas:                                          10
Deployment pods:                                       1 current / 0 desired
Conditions:
  Type           Status  Reason                   Message
  ----           ------  ------                   -------
  AbleToScale    True    SucceededGetScale        the HPA controller was able to get the target's current scale
  ScalingActive  False   FailedGetResourceMetric  the HPA was unable to compute the replica count: failed to get cpu utilization: missing request for cpu
Events:
  Type     Reason                        Age                  From                       Message
  ----     ------                        ----                 ----                       -------
  Warning  FailedComputeMetricsReplicas  19s (x12 over 3m4s)  horizontal-pod-autoscaler  invalid metrics (1 invalid out of 1), first error is: failed to get cpu utilization: missing request for cpu
  Warning  FailedGetResourceMetric       4s (x13 over 3m4s)   horizontal-pod-autoscaler  failed to get cpu utilization: missing request for cpu
我们可以看到上面的事件信息里面出现了 failed to get cpu utilization: missing request for cpu 这样的错误信息。这是因为我们上面创建的 Pod 对象没有添加 request 资源声明,这样导致 HPA 读取不到 CPU 指标信息,所以如果要想让 HPA 生效,对应的 Pod 资源必须添加 requests 资源声明,来更新我们的资源清单文件。
step5:资源清单文件里添加requests资源重新部署并查看
更新我们的资源清单文件,添加requests资源
[root@master1 ~]#vim hpa-demo.yaml
apiVersion: apps/v1
kind: Deployment
metadata:
  name: hpa-demo
spec:
  selector:
    matchLabels:
      app: nginx
  template:
    metadata:
      labels:
        app: nginx
    spec:
      containers:
      - name: nginx
        image: nginx
        ports:
        - containerPort: 80
        resources:
          requests:
            memory: 50Mi
            cpu: 50m
然后重新更新 Deployment,重新创建 HPA 对象:
[root@master1 ~]#kubectl apply -f hpa-demo.yaml
deployment.apps/hpa-demo configured

[root@master1 ~]#kubectl get po -l app=nginx -owide
NAME                        READY   STATUS    RESTARTS   AGE     IP             NODE    NOMINATED NODE   READINESS GATES
hpa-demo-6b4467b546-88rtv   1/1     Running   0          8m21s   10.244.2.154   node2   <none>           <none>
[root@master1 ~]#

[root@master1 ~]#kubectl delete hpa hpa-demo
horizontalpodautoscaler.autoscaling "hpa-demo" deleted
[root@master1 ~]#kubectl autoscale deployment hpa-demo --cpu-percent=10 --min=1 --max=10
horizontalpodautoscaler.autoscaling/hpa-demo autoscaled
[root@master1 ~]#kubectl get hpa #当然现在这个pod的资源使用率不可能是0%
NAME       REFERENCE             TARGETS   MINPODS   MAXPODS   REPLICAS   AGE
hpa-demo   Deployment/hpa-demo   0%/10%    1         10        1          30s

[root@master1 ~]#kubectl describe hpa hpa-demo
Name:                                                  hpa-demo
Namespace:                                             default
Labels:                                                <none>
Annotations:                                           <none>
CreationTimestamp:                                     Mon, 22 Nov 2021 19:29:16 +0800
Reference:                                             Deployment/hpa-demo
Metrics:                                               ( current / target )
  resource cpu on pods  (as a percentage of request):  0% (0) / 10%
Min replicas:                                          1
Max replicas:                                          10
Deployment pods:                                       1 current / 1 desired
Conditions:
  Type            Status  Reason               Message
  ----            ------  ------               -------
  AbleToScale     True    ScaleDownStabilized  recent recommendations were higher than current one, applying the highest recent recommendation
  ScalingActive   True    ValidMetricFound     the HPA was able to successfully calculate a replica count from cpu resource utilization (percentage of request)
  ScalingLimited  False   DesiredWithinRange   the desired count is within the acceptable range
Events:           <none>
[root@master1 ~]#
现在可以看到 HPA 资源对象已经正常了。
step6:我们来创建一个pod模拟增大负载进行测试
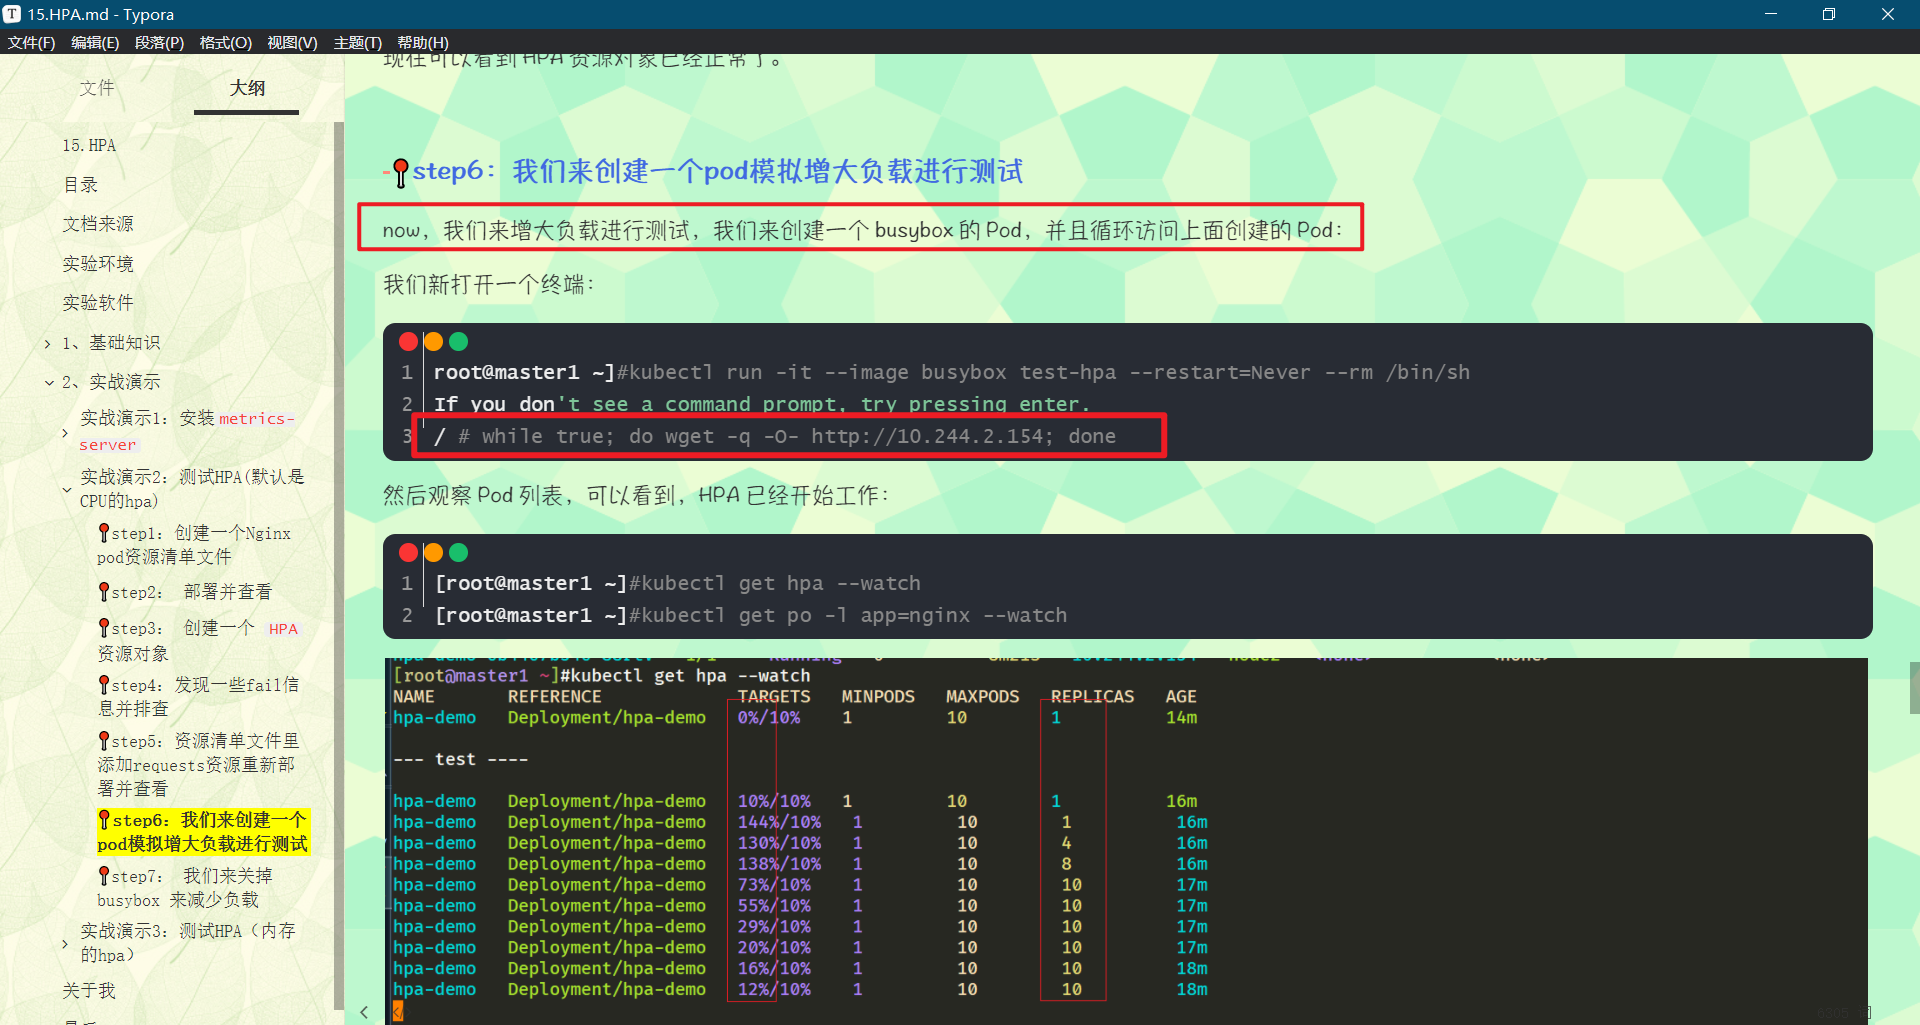
now,我们来增大负载进行测试,我们来创建一个 busybox 的 Pod,并且循环访问上面创建的 Pod:
我们新打开一个终端:
root@master1 ~]#kubectl run -it --image busybox test-hpa --restart=Never --rm /bin/sh
If you don't see a command prompt, try pressing enter.
/ # while true; do wget -q -O- http://10.244.2.154; done
然后观察 Pod 列表,可以看到,HPA 已经开始工作:
[root@master1 ~]#kubectl get hpa --watch
[root@master1 ~]#kubectl get po -l app=nginx --watch
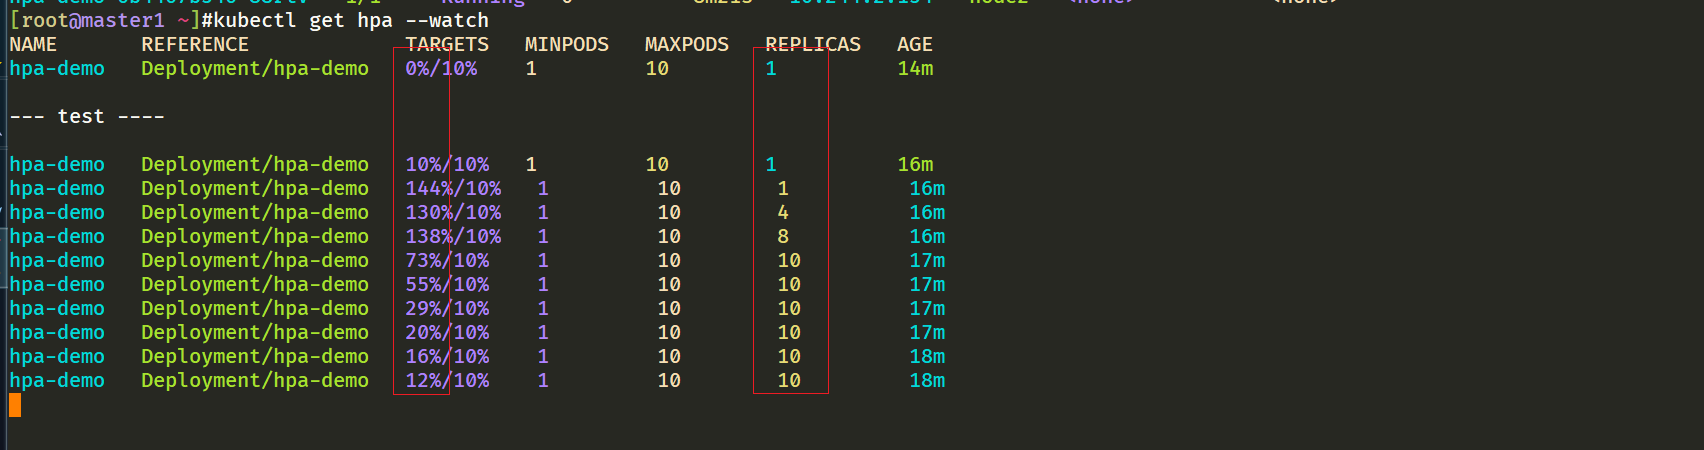
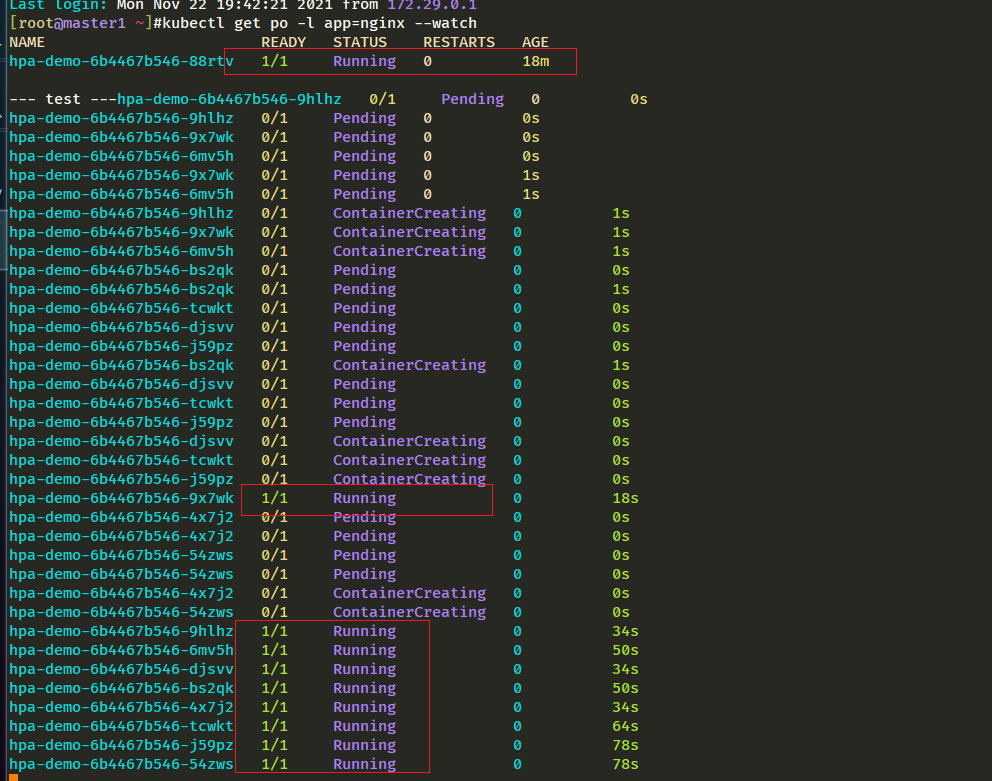
我们可以看到已经自动拉起了很多新的 Pod,最后会定格在了我们上面设置的 10 个 Pod,同时查看资源 hpa-demo 的副本数量,副本数量已经从原来的1变成了10个:
[root@master1 ~]#kubectl get deployments.apps hpa-demo
NAME       READY   UP-TO-DATE   AVAILABLE   AGE
hpa-demo   10/10   10           10          49m
[root@master1 ~]#
查看 HPA 资源的对象了解工作过程:
[root@master1 ~]#kubectl describe hpa hpa-demo
Name:                                                  hpa-demo
Namespace:                                             default
Labels:                                                <none>
Annotations:                                           <none>
CreationTimestamp:                                     Mon, 22 Nov 2021 19:29:16 +0800
Reference:                                             Deployment/hpa-demo
Metrics:                                               ( current / target )
  resource cpu on pods  (as a percentage of request):  15% (7m) / 10%
Min replicas:                                          1
Max replicas:                                          10
Deployment pods:                                       10 current / 10 desired
Conditions:
  Type            Status  Reason               Message
  ----            ------  ------               -------
  AbleToScale     True    ScaleDownStabilized  recent recommendations were higher than current one, applying the highest recent recommendation
  ScalingActive   True    ValidMetricFound     the HPA was able to successfully calculate a replica count from cpu resource utilization (percentage of request)
  ScalingLimited  True    TooManyReplicas      the desired replica count is more than the maximum replica count
Events:
  Type    Reason             Age    From                       Message
  ----    ------             ----   ----                       -------
  Normal  SuccessfulRescale  4m20s  horizontal-pod-autoscaler  New size: 4; reason: cpu resource utilization (percentage of request) above target
  Normal  SuccessfulRescale  4m5s   horizontal-pod-autoscaler  New size: 8; reason: cpu resource utilization (percentage of request) above target
  Normal  SuccessfulRescale  3m49s  horizontal-pod-autoscaler  New size: 10; reason: cpu resource utilization (percentage of request) above target
[root@master1 ~]#
step7: 我们来关掉 busybox 来减少负载
同样的这个时候我们来关掉 busybox 来减少负载,然后等待一段时间观察下 HPA 和 Deployment 对象:
[root@master1 ~]#kubectl get hpa --watch
NAME       REFERENCE             TARGETS   MINPODS   MAXPODS   REPLICAS   AGE
hpa-demo   Deployment/hpa-demo   16%/10%   1         10        10         21m


hpa-demo   Deployment/hpa-demo   12%/10%   1         10        10         21m
hpa-demo   Deployment/hpa-demo   0%/10%    1         10        10         21m

[root@master1 ~]#kubectl get po
NAME                        READY   STATUS    RESTARTS   AGE
hpa-demo-6b4467b546-4x7j2   1/1     Running   0          5m25s
hpa-demo-6b4467b546-54zws   1/1     Running   0          5m25s
hpa-demo-6b4467b546-6mv5h   1/1     Running   0          5m56s
hpa-demo-6b4467b546-88rtv   1/1     Running   0          26m
hpa-demo-6b4467b546-9hlhz   1/1     Running   0          5m56s
hpa-demo-6b4467b546-9x7wk   1/1     Running   0          5m56s
hpa-demo-6b4467b546-bs2qk   1/1     Running   0          5m41s
hpa-demo-6b4467b546-djsvv   1/1     Running   0          5m40s
hpa-demo-6b4467b546-j59pz   1/1     Running   0          5m40s
hpa-demo-6b4467b546-tcwkt   1/1     Running   0          5m40s


[root@master1 ~]#kubectl get deployments.apps  hpa-demo
NAME       READY   UP-TO-DATE   AVAILABLE   AGE
hpa-demo   10/10   10           10          51m
[root@master1 ~]#
缩放间隙:
从 Kubernetesv1.12版本开始我们可以通过设置kube-controller-manager组件的--horizontal-pod-autoscaler-downscale-stabilization参数来设置一个持续时间,用于指定在当前操作完成后,HPA必须等待多长时间才能执行另一次缩放操作。默认为5分钟,也就是默认需要等待5分钟后才会开始自动缩放。
可以看到副本数量已经由 10 变为 1,当前我们只是演示了 CPU 使用率这一个指标,在后面的课程中我们还会学习到根据自定义的监控指标来自动对 Pod 进行扩缩容。
实验结束。
实战演示3:测试HPA(内存的hpa)
注意:在做本次实验前,把上一个实验的all资源全部卸载掉,以方便精确测试实验。
step1: 创建资源清单文件
要使用基于内存或者自定义指标进行扩缩容(现在的版本都必须依赖 metrics-server 这个项目)。现在我们再用 Deployment 来创建一个 Nginx Pod,然后利用 HPA 来进行自动扩缩容。资源清单如下所示:
# hpa-mem-demo.yaml
apiVersion: apps/v1
kind: Deployment
metadata:
  name: hpa-mem-demo
spec:
  selector:
    matchLabels:
      app: nginx
  template:
    metadata:
      labels:
        app: nginx
    spec:
      volumes:
      - name: increase-mem-script
        configMap:
          name: increase-mem-config
      containers:
      - name: nginx
        image: nginx
        ports:
        - containerPort: 80
        volumeMounts:
        - name: increase-mem-script
          mountPath: /etc/script
        resources:
          requests:
            memory: 50Mi
            cpu: 50m
        securityContext:
          privileged: true
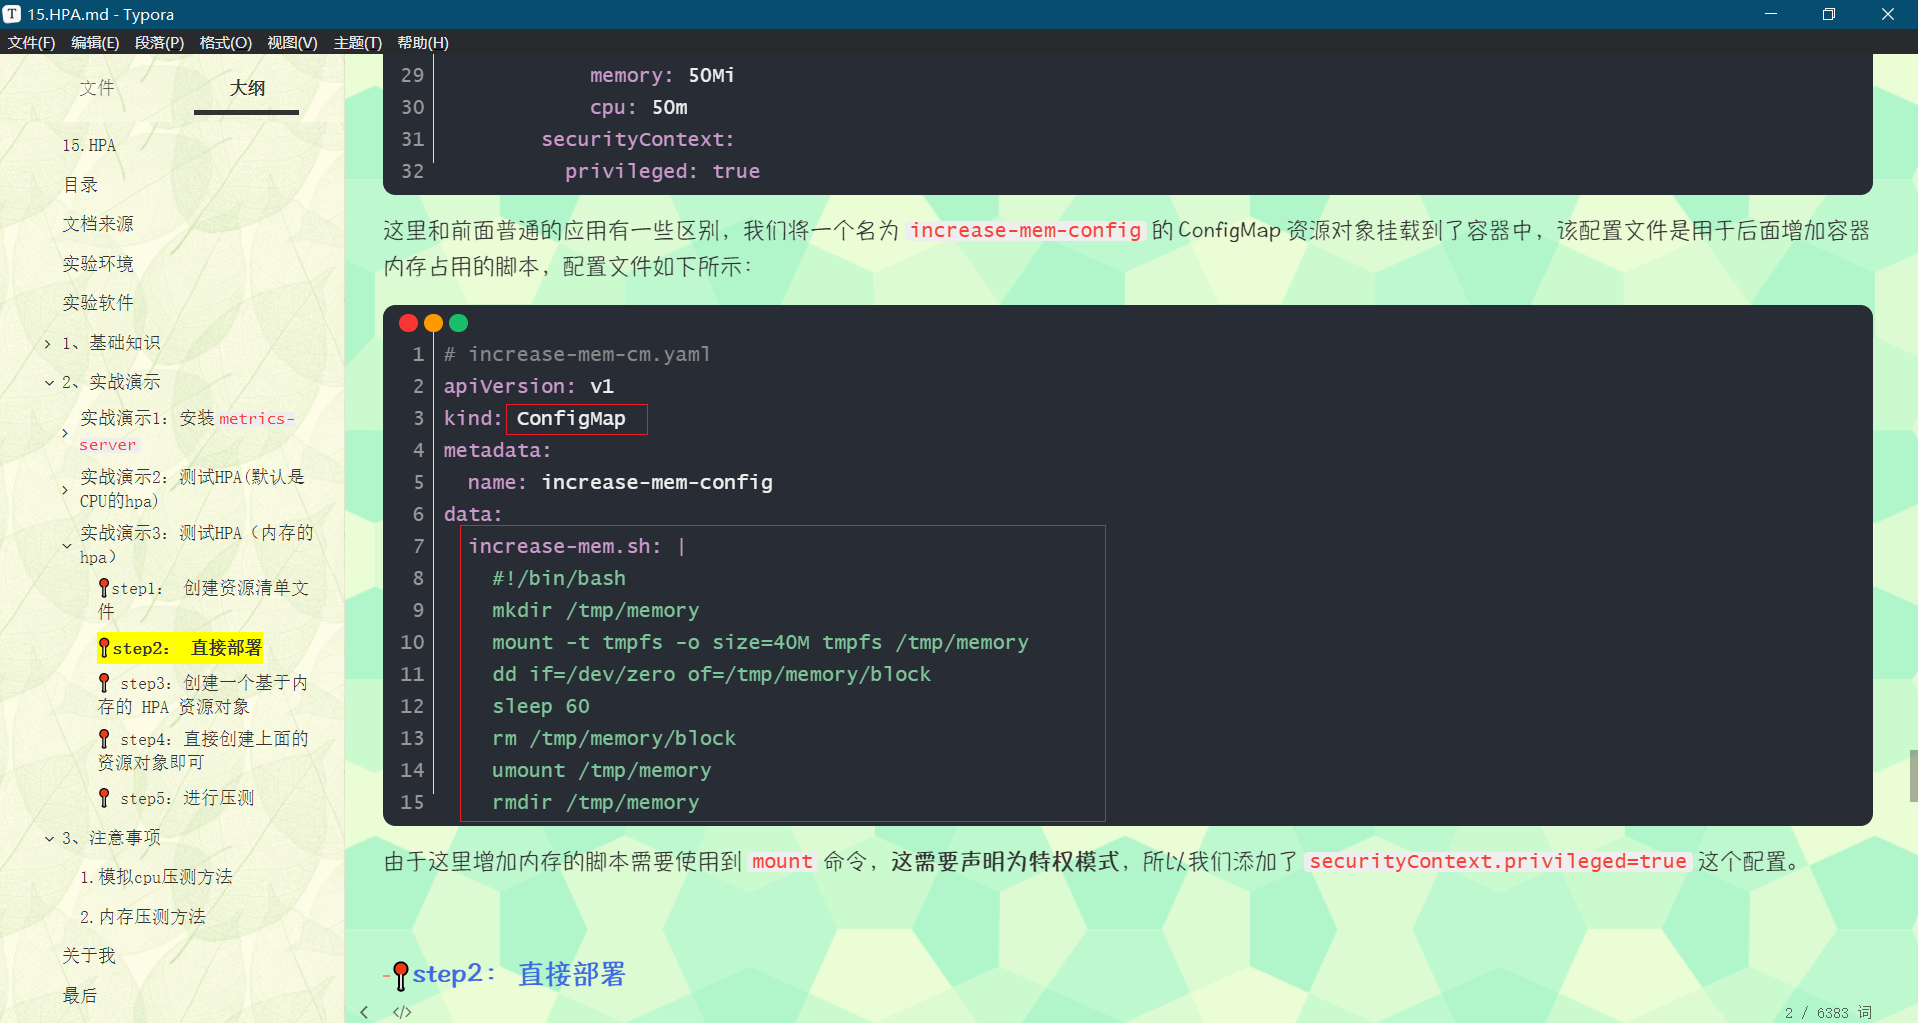
这里和前面普通的应用有一些区别,我们将一个名为 increase-mem-config 的 ConfigMap 资源对象挂载到了容器中,该配置文件是用于后面增加容器内存占用的脚本,配置文件如下所示:
# increase-mem-cm.yaml
apiVersion: v1
kind: ConfigMap
metadata:
  name: increase-mem-config
data:
  increase-mem.sh: |
    #!/bin/bash
    mkdir /tmp/memory
    mount -t tmpfs -o size=40M tmpfs /tmp/memory
    dd if=/dev/zero of=/tmp/memory/block
    sleep 60
    rm /tmp/memory/block
    umount /tmp/memory
    rmdir /tmp/memory
由于这里增加内存的脚本需要使用到 mount 命令,这需要声明为特权模式,所以我们添加了 securityContext.privileged=true 这个配置。
step2: 直接部署
现在我们直接创建上面的资源对象即可:
[root@master1 ~]#kubectl apply -f hpa-mem-demo.yaml
deployment.apps/hpa-mem-demo created
[root@master1 ~]#kubectl apply -f increase-mem-cm.yaml
configmap/increase-mem-config created
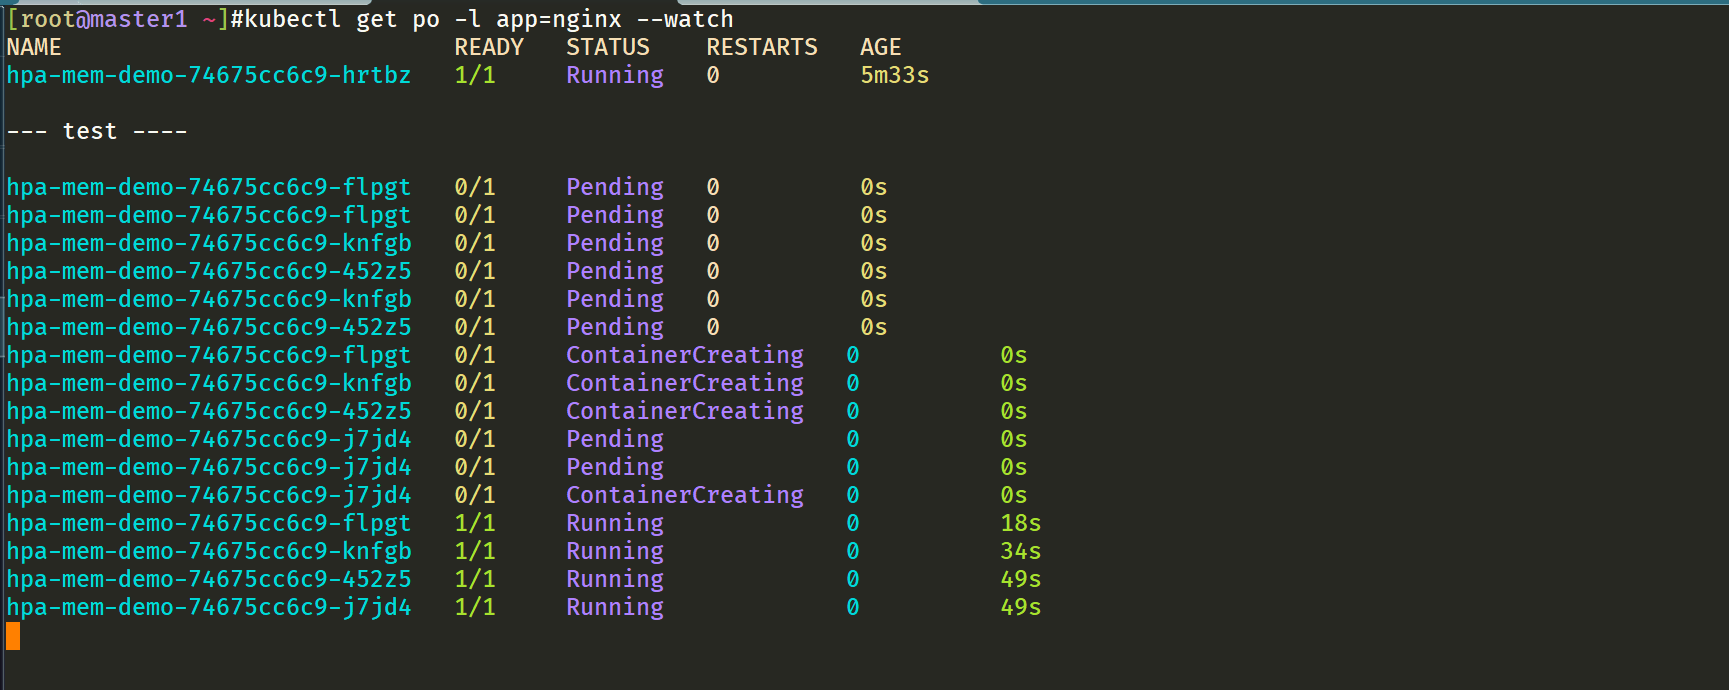
[root@master1 ~]#kubectl get po -l app=nginx
NAME READY STATUS RESTARTS AGE
hpa-mem-demo-74675cc6c9-hrtbz 1/1 Running 0 28s
step3:创建一个基于内存的 HPA 资源对象
然后需要创建一个基于内存的 HPA 资源对象:
[root@master1 ~]#vim hpa-mem.yaml
# hpa-mem.yaml
apiVersion: autoscaling/v2beta1 #注意:这里是v2beta1
kind: HorizontalPodAutoscaler
metadata:
  name: hpa-mem-demo
  namespace: default
spec:
  maxReplicas: 5
  minReplicas: 1
  scaleTargetRef:
    apiVersion: apps/v1
    kind: Deployment
    name: hpa-mem-demo
  metrics:  # 指定内存的一个配置
  - type: Resource
    resource:
      name: memory
      targetAverageUtilization: 20
要注意这里使用的 apiVersion 是 autoscaling/v2beta1,然后 metrics 属性里面指定的是内存的配置。
注意:扩容目标引用(scaleTargetRef ):
扩容目标引用(scaleTargetRef ):后面可以是一个deployment或者是replicaset。
一个hpa和一个例如deployment是一一对应的。
step4:直接创建上面的资源对象即可
[root@master1 ~]#kubectl apply -f hpa-mem.yaml
Warning: autoscaling/v2beta1 HorizontalPodAutoscaler is deprecated in v1.22+, unavailable in v1.25+; use autoscaling/v2beta2 HorizontalPodAutoscaler
horizontalpodautoscaler.autoscaling/hpa-mem-demo created
[root@master1 ~]#kubectl get hpa
NAME           REFERENCE                 TARGETS   MINPODS   MAXPODS   REPLICAS   AGE
hpa-mem-demo   Deployment/hpa-mem-demo   3%/20%    1         5         1          39s
[root@master1 ~]#
到这里证明 HPA 资源对象已经部署成功了。
step5:进行压测
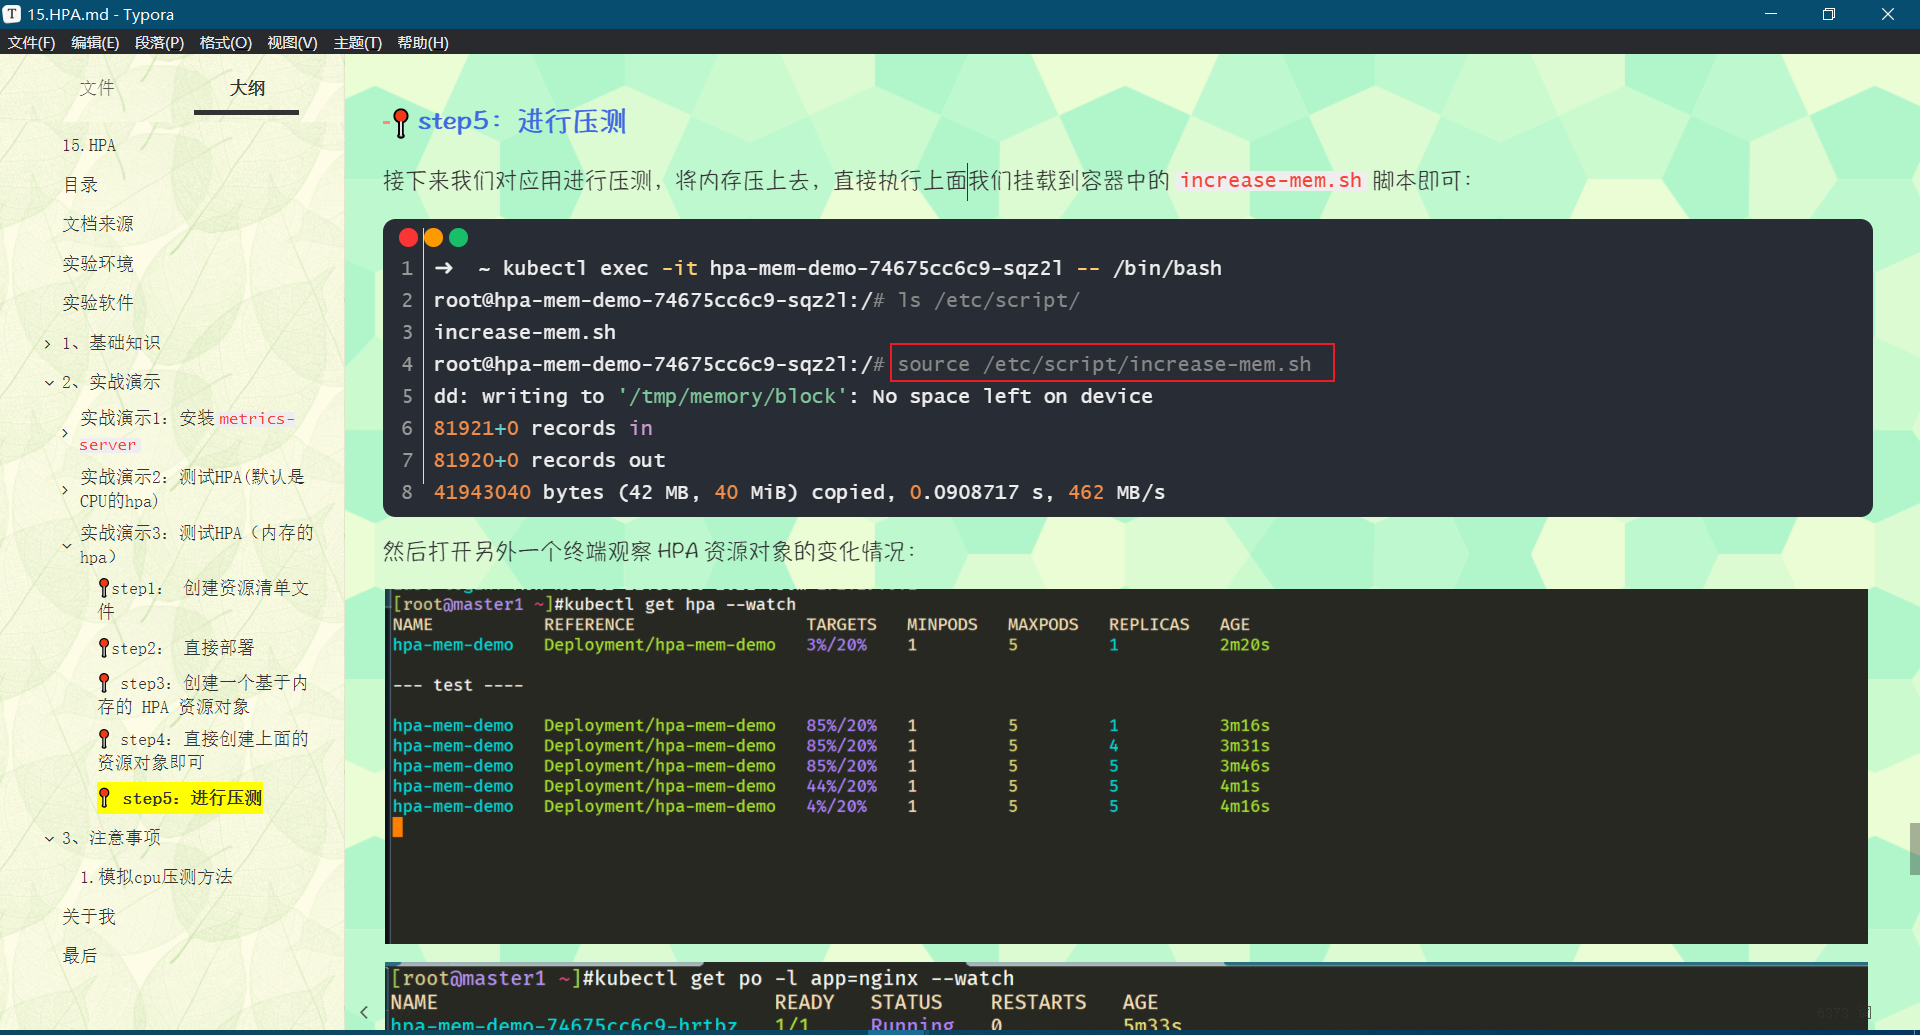
接下来我们对应用进行压测,将内存压上去,直接执行上面我们挂载到容器中的 increase-mem.sh 脚本即可:
➜  ~ kubectl exec -it hpa-mem-demo-74675cc6c9-sqz2l -- /bin/bash
root@hpa-mem-demo-74675cc6c9-sqz2l:/# ls /etc/script/
increase-mem.sh
root@hpa-mem-demo-74675cc6c9-sqz2l:/# source /etc/script/increase-mem.sh
dd: writing to '/tmp/memory/block': No space left on device
81921+0 records in
81920+0 records out
41943040 bytes (42 MB, 40 MiB) copied, 0.0908717 s, 462 MB/s
然后打开另外一个终端观察 HPA 资源对象的变化情况:
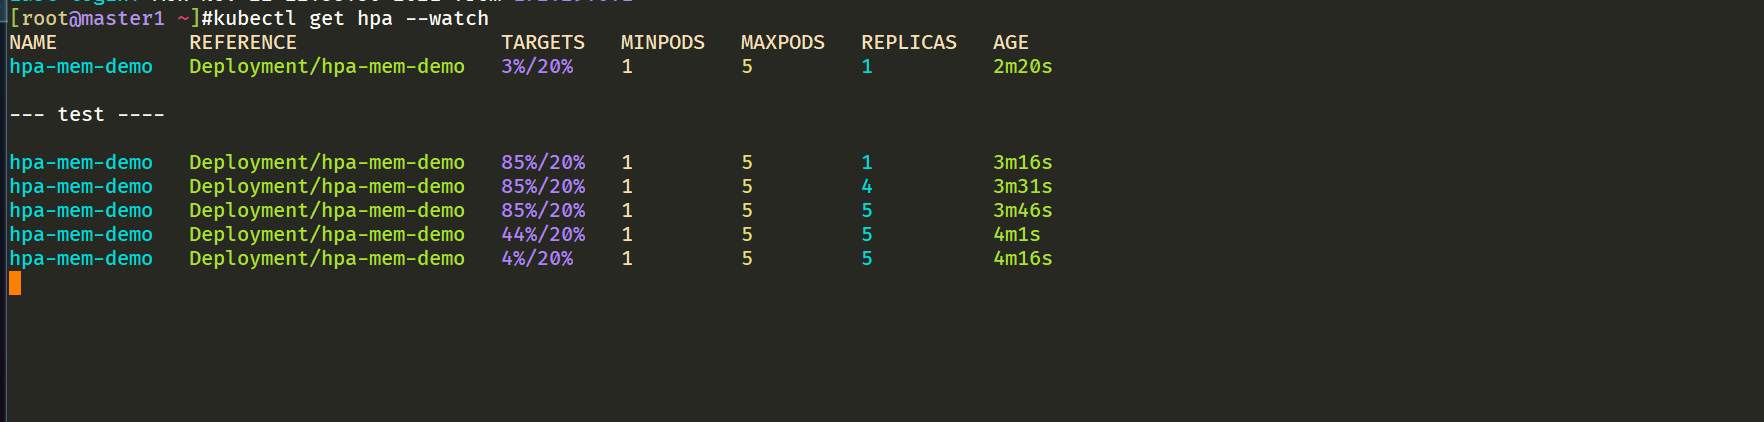
➜  ~ kubectl get hpa -w
NAME           REFERENCE                 TARGETS   MINPODS   MAXPODS   REPLICAS   AGE
hpa-mem-demo   Deployment/hpa-mem-demo   87%/30%   1         5         3          90s
➜  ~ kubectl describe hpa hpa-mem-demo
Name:                                                     hpa-mem-demo
Namespace:                                                default
Labels:                                                   <none>
Annotations:                                              kubectl.kubernetes.io/last-applied-configuration:
                                                            {
    "apiVersion":"autoscaling/v2beta1","kind":"HorizontalPodAutoscaler","metadata":{
    "annotations":{
    },"name":"hpa-mem-demo","namespace":"defau...
CreationTimestamp:                                        Mon, 15 Nov 2021 18:40:37 +0800
Reference:                                                Deployment/hpa-mem-demo
Metrics:                                                  ( current / target )
  resource memory on pods  (as a percentage of request):  87% (45752320) / 30%
Min replicas:                                             1
Max replicas:                                             5
Deployment pods:                                          3 current / 3 desired
Conditions:
  Type            Status  Reason              Message
  ----            ------  ------              -------
  AbleToScale     True    ReadyForNewScale    recommended size matches current size
  ScalingActive   True    ValidMetricFound    the HPA was able to successfully calculate a replica count from memory resource utilization (percentage of request)
  ScalingLimited  False   DesiredWithinRange  the desired count is within the acceptable range
Events:
  Type     Reason                        Age   From                       Message
  ----     ------                        ----  ----                       -------
  Warning  FailedGetResourceMetric       87s   horizontal-pod-autoscaler  failed to get memory utilization: unable to get metrics for resource memory: no metrics returned from resource metrics API
  Warning  FailedComputeMetricsReplicas  87s   horizontal-pod-autoscaler  invalid metrics (1 invalid out of 1), first error is: failed to get memory utilization: unable to get metrics for resource memory: no metrics returned from resource metrics API
  Normal   SuccessfulRescale             27s   horizontal-pod-autoscaler  New size: 3; reason: memory resource utilization (percentage of request) above target
  Normal   SuccessfulRescale             46s    horizontal-pod-autoscaler  New size: 4; reason: memory resource utilization (percentage of request) above target
➜  ~ kubectl top pod hpa-mem-demo-74675cc6c9-gbj9t
NAME                            CPU(cores)   MEMORY(bytes)
hpa-mem-demo-66944b79bf-tqrn9   0m           41Mi
可以看到内存使用已经超过了我们设定的 30% 这个阈值了,HPA 资源对象也已经触发了自动扩容,变成了4个副本了:
➜  ~ kubectl get pods -l app=nginx
NAME                            READY   STATUS    RESTARTS   AGE
hpa-mem-demo-74675cc6c9-cpdw4   1/1     Running   0          69s
hpa-mem-demo-74675cc6c9-s8bz4   1/1     Running   0          114s
hpa-mem-demo-74675cc6c9-sqz2l   1/1     Running   0          3m9s
hpa-mem-demo-74675cc6c9-z8cx8   1/1     Running   0          114s
当内存释放掉后,controller-manager 默认5分钟过后会进行缩放,到这里就完成了基于内存的 HPA 操作。
实验结束。
3、注意事项
1.cpu压测方法
root@master1 ~]#kubectl run -it --image busybox test-hpa --restart=Never --rm /bin/sh
If you don't see a command prompt, try pressing enter.
/ # while true; do wget -q -O- http://10.244.2.154; done
2.内存压测方法
3.ConfigMap的写法
要使用基于内存或者自定义指标进行扩缩容(现在的版本都必须依赖 metrics-server 这个项目)。现在我们再用 Deployment 来创建一个 Nginx Pod,然后利用 HPA 来进行自动扩缩容。资源清单如下所示:
# hpa-mem-demo.yaml
apiVersion: apps/v1
kind: Deployment
metadata:
  name: hpa-mem-demo
spec:
  selector:
    matchLabels:
      app: nginx
  template:
    metadata:
      labels:
        app: nginx
    spec:
      volumes:
      - name: increase-mem-script
        configMap:
          name: increase-mem-config
      containers:
      - name: nginx
        image: nginx
        ports:
        - containerPort: 80
        volumeMounts:
        - name: increase-mem-script
          mountPath: /etc/script
        resources:
          requests:
            memory: 50Mi
            cpu: 50m
        securityContext:
          privileged: true
这里和前面普通的应用有一些区别,我们将一个名为 increase-mem-config 的 ConfigMap 资源对象挂载到了容器中,该配置文件是用于后面增加容器内存占用的脚本,配置文件如下所示:
# increase-mem-cm.yaml
apiVersion: v1
kind: ConfigMap
metadata:
  name: increase-mem-config
data:
  increase-mem.sh: |
    #!/bin/bash
    mkdir /tmp/memory
    mount -t tmpfs -o size=40M tmpfs /tmp/memory
    dd if=/dev/zero of=/tmp/memory/block
    sleep 60
    rm /tmp/memory/block
    umount /tmp/memory
    rmdir /tmp/memory
由于这里增加内存的脚本需要使用到 mount 命令,这需要声明为特权模式,所以我们添加了 securityContext.privileged=true 这个配置。
关于我
我的博客主旨:我希望每一个人拿着我的博客都可以做出实验现象,先把实验做出来,然后再结合理论知识更深层次去理解技术点,这样学习起来才有乐趣和动力。并且,我的博客内容步骤是很完整的,也分享源码和实验用到的软件,希望能和大家一起共同进步!
各位小伙伴在实际操作过程中如有什么疑问,可随时联系本人免费帮您解决问题:
-
个人微信二维码:x2675263825 (舍得), qq:2675263825。

-
个人博客地址:www.onlyonexl.cn
-
个人微信公众号:云原生架构师实战

-
个人csdn
https://blog.csdn.net/weixin_39246554?spm=1010.2135.3001.5421

最后
好了,关于HPA实验就到这里了,感谢大家阅读,最后贴上我女神的photo,祝大家生活快乐,每天都过的有意义哦,我们下期见!
智能推荐
874计算机科学基础综合,2018年四川大学874计算机科学专业基础综合之计算机操作系统考研仿真模拟五套题...-程序员宅基地
文章浏览阅读1.1k次。一、选择题1. 串行接口是指( )。A. 接口与系统总线之间串行传送,接口与I/0设备之间串行传送B. 接口与系统总线之间串行传送,接口与1/0设备之间并行传送C. 接口与系统总线之间并行传送,接口与I/0设备之间串行传送D. 接口与系统总线之间并行传送,接口与I/0设备之间并行传送【答案】C2. 最容易造成很多小碎片的可变分区分配算法是( )。A. 首次适应算法B. 最佳适应算法..._874 计算机科学专业基础综合题型
XShell连接失败:Could not connect to '192.168.191.128' (port 22): Connection failed._could not connect to '192.168.17.128' (port 22): c-程序员宅基地
文章浏览阅读9.7k次,点赞5次,收藏15次。连接xshell失败,报错如下图,怎么解决呢。1、通过ps -e|grep ssh命令判断是否安装ssh服务2、如果只有客户端安装了,服务器没有安装,则需要安装ssh服务器,命令:apt-get install openssh-server3、安装成功之后,启动ssh服务,命令:/etc/init.d/ssh start4、通过ps -e|grep ssh命令再次判断是否正确启动..._could not connect to '192.168.17.128' (port 22): connection failed.
杰理之KeyPage【篇】_杰理 空白芯片 烧入key文件-程序员宅基地
文章浏览阅读209次。00000000_杰理 空白芯片 烧入key文件
一文读懂ChatGPT,满足你对chatGPT的好奇心_引发对chatgpt兴趣的表述-程序员宅基地
文章浏览阅读475次。2023年初,“ChatGPT”一词在社交媒体上引起了热议,人们纷纷探讨它的本质和对社会的影响。就连央视新闻也对此进行了报道。作为新传专业的前沿人士,我们当然不能忽视这一热点。本文将全面解析ChatGPT,打开“技术黑箱”,探讨它对新闻与传播领域的影响。_引发对chatgpt兴趣的表述
中文字符频率统计python_用Python数据分析方法进行汉字声调频率统计分析-程序员宅基地
文章浏览阅读259次。用Python数据分析方法进行汉字声调频率统计分析木合塔尔·沙地克;布合力齐姑丽·瓦斯力【期刊名称】《电脑知识与技术》【年(卷),期】2017(013)035【摘要】该文首先用Python程序,自动获取基本汉字字符集中的所有汉字,然后用汉字拼音转换工具pypinyin把所有汉字转换成拼音,最后根据所有汉字的拼音声调,统计并可视化拼音声调的占比.【总页数】2页(13-14)【关键词】数据分析;数据可..._汉字声调频率统计
linux输出信息调试信息重定向-程序员宅基地
文章浏览阅读64次。最近在做一个android系统移植的项目,所使用的开发板com1是调试串口,就是说会有uboot和kernel的调试信息打印在com1上(ttySAC0)。因为后期要使用ttySAC0作为上层应用通信串口,所以要把所有的调试信息都给去掉。参考网上的几篇文章,自己做了如下修改,终于把调试信息重定向到ttySAC1上了,在这做下记录。参考文章有:http://blog.csdn.net/longt..._嵌入式rootfs 输出重定向到/dev/console
随便推点
uniapp 引入iconfont图标库彩色symbol教程_uniapp symbol图标-程序员宅基地
文章浏览阅读1.2k次,点赞4次,收藏12次。1,先去iconfont登录,然后选择图标加入购物车 2,点击又上角车车添加进入项目我的项目中就会出现选择的图标 3,点击下载至本地,然后解压文件夹,然后切换到uniapp打开终端运行注:要保证自己电脑有安装node(没有安装node可以去官网下载Node.js 中文网)npm i -g iconfont-tools(mac用户失败的话在前面加个sudo,password就是自己的开机密码吧)4,终端切换到上面解压的文件夹里面,运行iconfont-tools 这些可以默认也可以自己命名(我是自己命名的_uniapp symbol图标
C、C++ 对于char*和char[]的理解_c++ char*-程序员宅基地
文章浏览阅读1.2w次,点赞25次,收藏192次。char*和char[]都是指针,指向第一个字符所在的地址,但char*是常量的指针,char[]是指针的常量_c++ char*
Sublime Text2 使用教程-程序员宅基地
文章浏览阅读930次。代码编辑器或者文本编辑器,对于程序员来说,就像剑与战士一样,谁都想拥有一把可以随心驾驭且锋利无比的宝剑,而每一位程序员,同样会去追求最适合自己的强大、灵活的编辑器,相信你和我一样,都不会例外。我用过的编辑器不少,真不少~ 但却没有哪款让我特别心仪的,直到我遇到了 Sublime Text 2 !如果说“神器”是我能给予一款软件最高的评价,那么我很乐意为它封上这么一个称号。它小巧绿色且速度非
对10个整数进行按照从小到大的顺序排序用选择法和冒泡排序_对十个数进行大小排序java-程序员宅基地
文章浏览阅读4.1k次。一、选择法这是每一个数出来跟后面所有的进行比较。2.冒泡排序法,是两个相邻的进行对比。_对十个数进行大小排序java
物联网开发笔记——使用网络调试助手连接阿里云物联网平台(基于MQTT协议)_网络调试助手连接阿里云连不上-程序员宅基地
文章浏览阅读2.9k次。物联网开发笔记——使用网络调试助手连接阿里云物联网平台(基于MQTT协议)其实作者本意是使用4G模块来实现与阿里云物联网平台的连接过程,但是由于自己用的4G模块自身的限制,使得阿里云连接总是无法建立,已经联系客服返厂检修了,于是我在此使用网络调试助手来演示如何与阿里云物联网平台建立连接。一.准备工作1.MQTT协议说明文档(3.1.1版本)2.网络调试助手(可使用域名与服务器建立连接)PS:与阿里云建立连解释,最好使用域名来完成连接过程,而不是使用IP号。这里我跟阿里云的售后工程师咨询过,表示对应_网络调试助手连接阿里云连不上
<<<零基础C++速成>>>_无c语言基础c++期末速成-程序员宅基地
文章浏览阅读544次,点赞5次,收藏6次。运算符与表达式任何高级程序设计语言中,表达式都是最基本的组成部分,可以说C++中的大部分语句都是由表达式构成的。_无c语言基础c++期末速成